

Bazaarvoice digs down into its platform data from March to May 2020 to show the changes in online shopping habits during the lockdown
With an overwhelming amount of information available about the impact of COVID-19, it can feel difficult to identify which information is relevant to your business and how it should shape your strategy moving forward.
With a network of over 6,200 brand and retailer sites as our client base, we have unique visibility into shopping activity. To combat some of the fatigue from combing through multiple information sources, we regularly compiled data from across our network to help you understand how this pandemic is influencing consumers.
We watched for patterns and changes in shopping behavior – increases and decreases in product page views, orders placed, reviews submitted, and more. We looked at the data globally and across more than 20 product categories and compared it to the same time period in 2019, as well as earlier months in 2020.
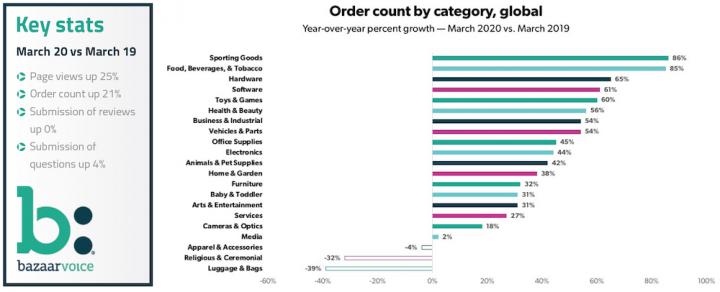
Throughout the month of March, data from our network shows that customers started to prepare for the long haul of being home. Year-over-year, we saw page views and order counts increase 25% and 21%, respectively. Looking at order numbers for 2020 in itself, March orders are up from February. While order count in 2020 saw a 2% YOY increase in January and a 6% increase in February, it jumped to a 21% increase in March, when social distancing and shelter-in-place advisories started to become widely adopted.
In addition, the top ten days with the most orders on our network in 2020 happened in March. Order count began to surge on March 11th, the same day the World Health Organization declared COVID-19 a global pandemic and the US-Europe travel ban was announced.
We saw year-over-year page view and order count increases across almost every product category. Food, Beverages, and Tobacco, Toys and Games, and Sporting Goods were the three categories that were in the top five for growth in both page views and order count. As consumers evaluated what they needed to live comfortably and entertain themselves and their children for the duration of stay-at-home orders, it’s not surprising these are the categories they’ve been drawn to.
The growth in the Food, Beverages, and Tobacco category was especially noteworthy as more shoppers have turned to online grocery shopping, some for the first time. Similarly, categories like Business and Industrial (includes work safety gear and medical products), Office Supplies, and Software also saw high growth in March.
While consumer browsing activity is on par with last year for Apparel and Accessories products, buying behavior is down. Understandably, browsing and buying behavior for Luggage and Bags products are down as consumers are not leaving the house or traveling.
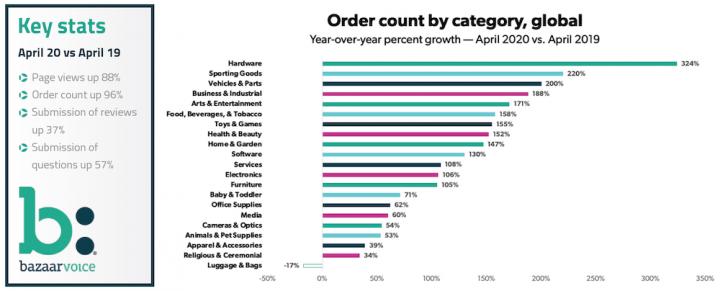
Based on the data, March 2020 growth was massive for e-commerce, but April 2020 grew even faster with every indicator we track (page views, order count, review submission, question submission) more than 3x the March 2020 numbers, and growth in each is growing more than 2.5x faster than it was pre-crisis.
March ended with a 25% YOY growth for page views, and April ended with an 88% increase. Page view growth accelerated every week since the week beginning March 15. Order count was also trending upward, with April 2020 year-over-year growth of 96%. For comparison – March closed with a 21% YOY increase in order count. While in March, browsing behavior (page views) was outpacing purchasing behavior (order count), this trend reversed in April, with consumers buying more this month.
While the week of April 19-25th had the highest percentage of year-over-year growth for order count, order count slowed a little bit over the final week of April. This could potentially be because the end of the month may be a more challenging time for consumers financially, particularly with unemployment climbing.
When COVID-19 was first declared a global pandemic, consumers rushed to buy non-perishable food items, face masks, and home office supplies, and our network data reflected that.
When we first looked at data towards the end of March, the top categories for page view growth were Business and Industrial, followed by Toys and Games, Food, Beverage, and Tobacco, Office Supplies, and Health and Beauty. Finishing the month of April, the top categories for page views were Toys and Games, Arts and Entertainment, Sporting Goods, Animals and Pet Supplies, and Business and Industrial.
Looking at order count growth, March saw Food, Beverages, and Tobacco growing the most year-over-year, followed by Sporting Goods, Business and Industrial, Software, and Health and Beauty. For April, the top five categories were Hardware, Sporting Goods, Vehicles and Parts, Business and Industrial, and Arts and Entertainment.
Shoppers had adjusted to the new normal and were finding ways to keep occupied and productive during an uncertain time period. They took this month to build their home gyms, find new forms of entertainment, take extra care of their pets, and start DIY projects at home, including car repairs.
When looking at the number of reviews submitted by consumers across our clients, March saw 0% growth year-over-year — that changed drastically in April with a 37% increase year-over-year. Many shoppers made a larger percentage of purchases online than they had in the past, which could have been triggering more post-interaction emails than usual.
Spikes in review submission often occur after spikes in purchases, with the delay accounting for shoppers receiving their items. Review submission in April surpassed growth seen in that time frame last year, and the partial week of April 26-30 saw the highest review submission YOY growth this year up until this point with a 64% increase.
Question submission saw even larger growth. In April, question submission was up 57% year-over-year, compared to just 4% YOY in March. The week of April 19-25th saw the highest YOY growth for question submissions with a 77% increase.
This influx of reviews and questions from shoppers helps other shoppers make informed purchases and buy with greater confidence. For brands, this influx supports conversion and provides additional customer insights at a time when shoppers needs are changing.
Brands should identify highlights and lowlights of their products from reviews, compile or update an existing list of frequently asked questions, and respond to customers as they reach out. Shoppers will remember the brands who made their quarantine easier.
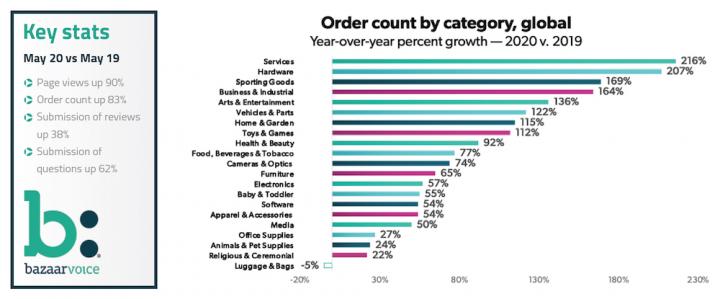
While May 2020 experienced a period of significant, sustained growth, buying behavior slowed down slightly compared to April 2020. May saw a YOY growth rate of 83% compared to May 2019, while April saw an order count increase of 96% year-over-year compared to April 2019. Based on the trends in the second half of May, it seems that April will serve as the growth peak.
Pre-crisis we typically saw shoppers browse more than they bought; however, in late March and continuing through much of April we saw buying outpace browsing. Order count began to surge on March 11th, the same day the World Health Organization declared COVID-19 a global pandemic and the US-Europe travel ban was announced.
In May, shopper behavior returned to the pre-crisis pattern of browsing outpacing buying.
On top of browsing, shoppers were continuing to leave more reviews and ask more questions, benefitting future shoppers as they reach the buying decision phase of the shopper journey.
While many countries and towns were still in varying degrees of shelter-in-place or lockdown, some markets began to reopen and this has led to a shift in consumer buying behavior. Many categories saw order count and page view year-over-year growth moderate between April and May.
The Services category bucked the trend, growing faster in May than in April. Services (which includes education, financial services, real estate, and travel) saw page view growth more than double, reaching 62% YOY in May, compared to 26% in April. Service order count accelerated to 216% YOY in May, compared to 128% in April.
With many travel bans lifted and economies reopening, some of the services previously less utilized during lockdown were seeing greater need. For example – in the U.S., more housing listings were appearing online than in the previous month, and hotel bookings and air travel were both trending upwards.
This article first appeared in the summer edition of the Sync NI magazine and it can be found here.